Work report
Answers where did the hours on this project go — by work package, by client service, and against the budget.
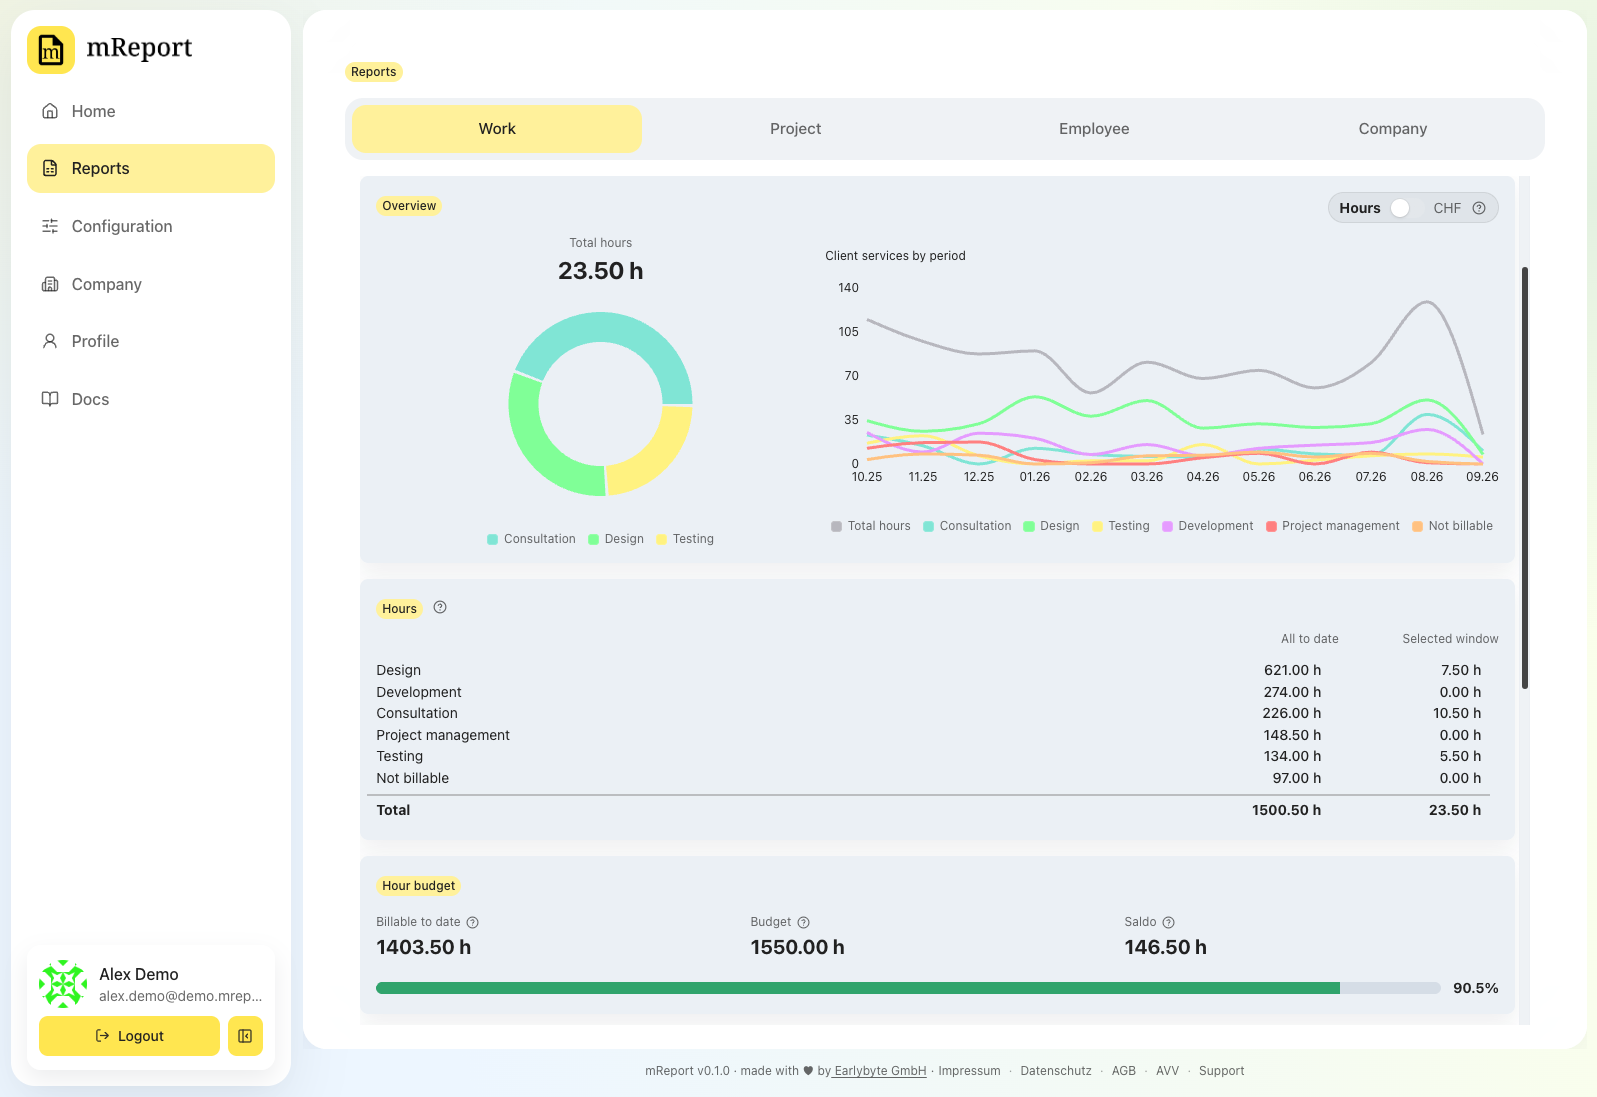
Hours and CHF
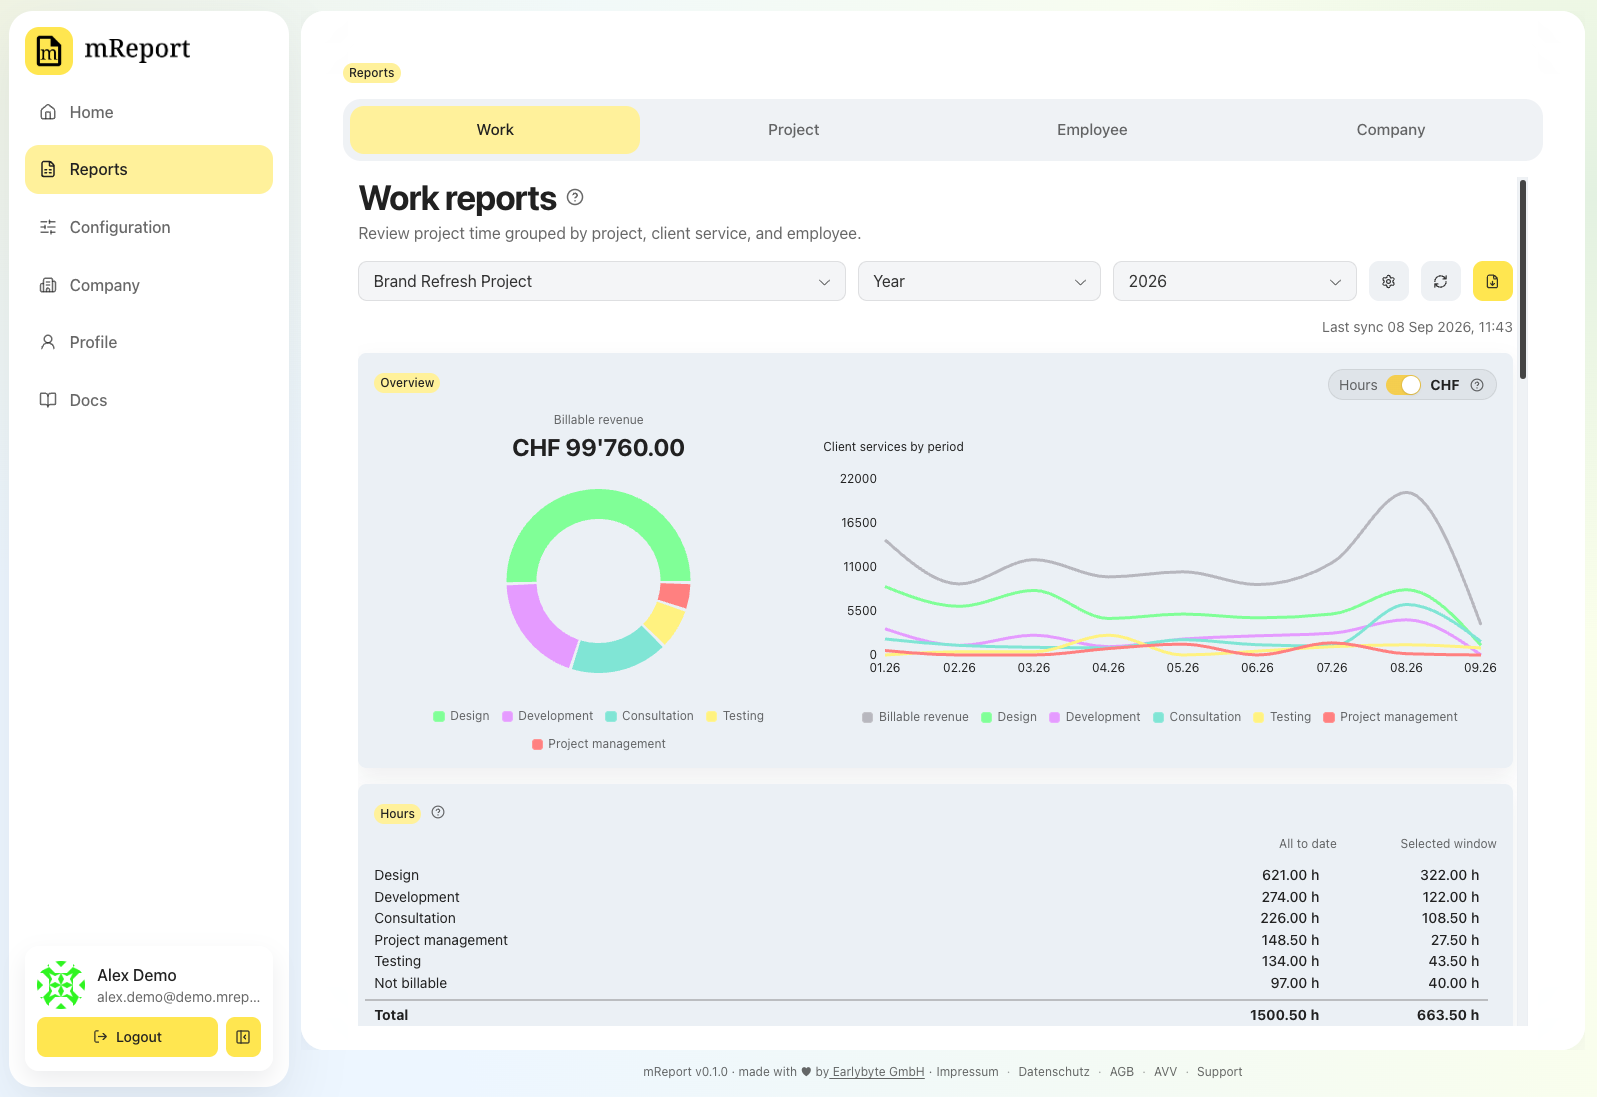
The toggle switches the whole report between hours and CHF. The CHF view multiplies hours by the hourly rate from the report configuration.
Hours
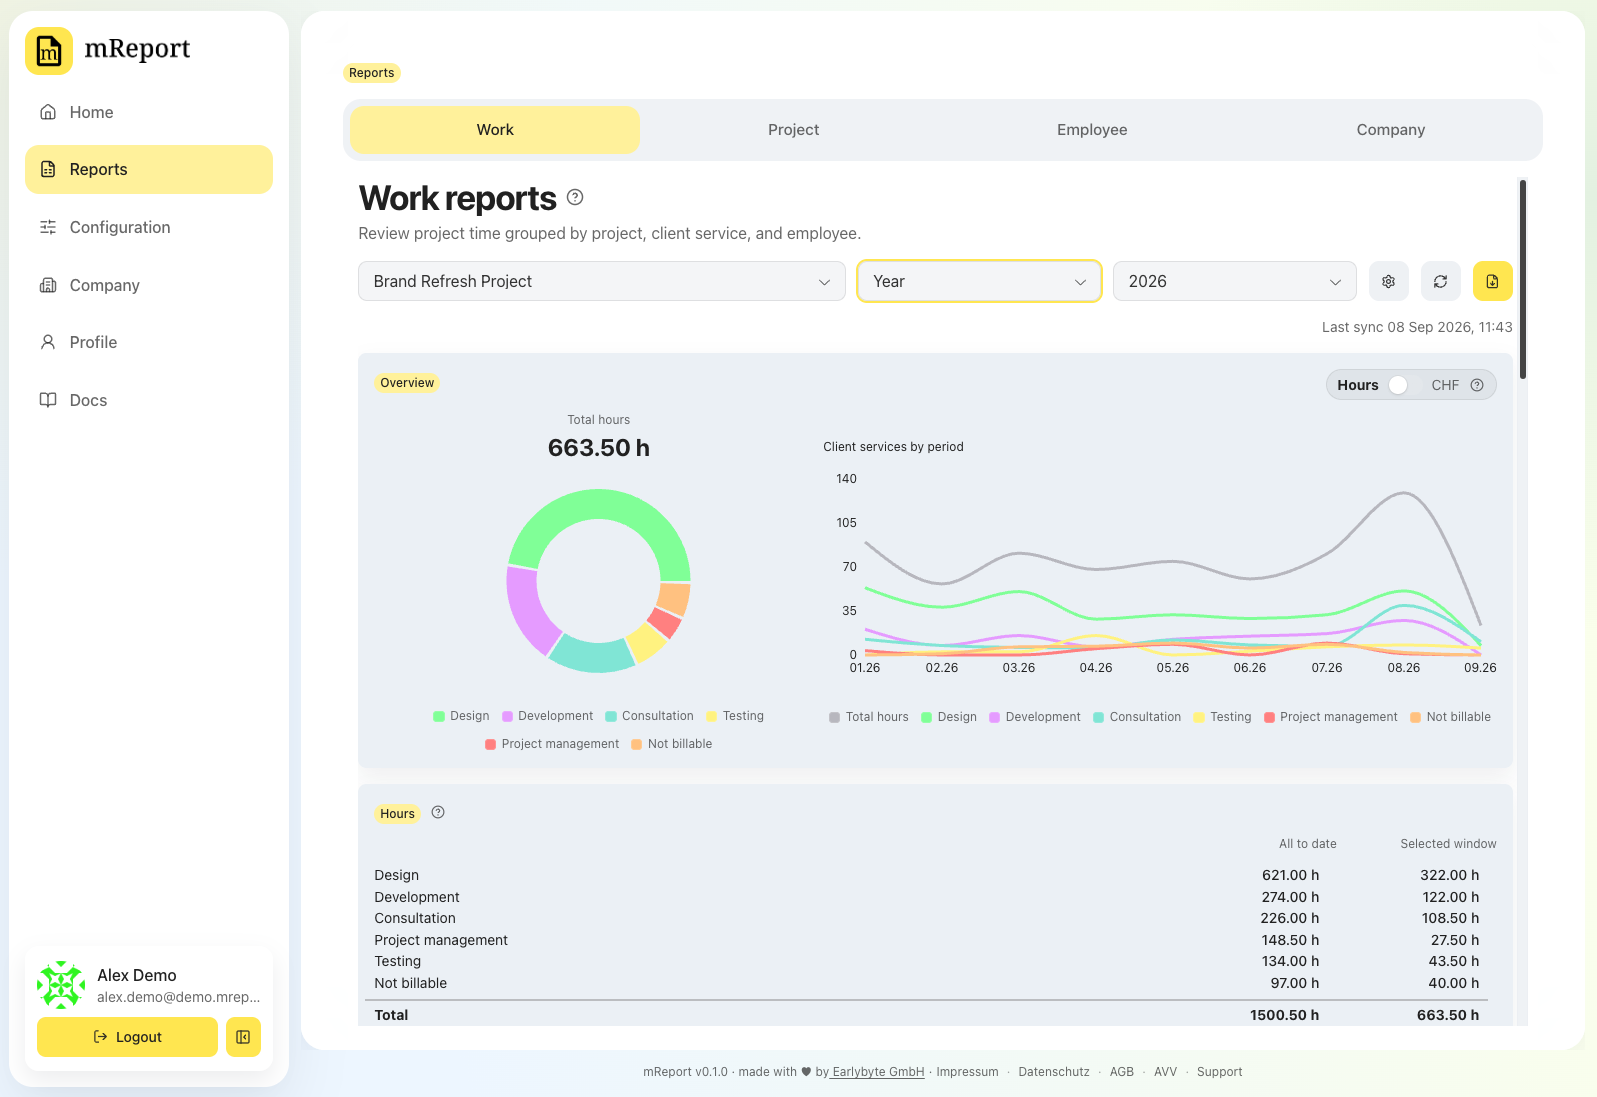
One table, grouped two ways: each billability group — billable, non-billable, internal — heads its own client services, carries its own subtotal, and a grand total closes it. Both columns are shown throughout: all to date for the whole project, and the selected window.
The donut above it shows the same hours twice over: client services in the body, and the same slices summed by billability as a band around them. The two line up — the band's billable arc covers exactly the services it is the sum of.
What the table contains is up to the report configuration — see hours per client service and per billability. Whatever is switched on appears both here and in the PDF.
Hour budget
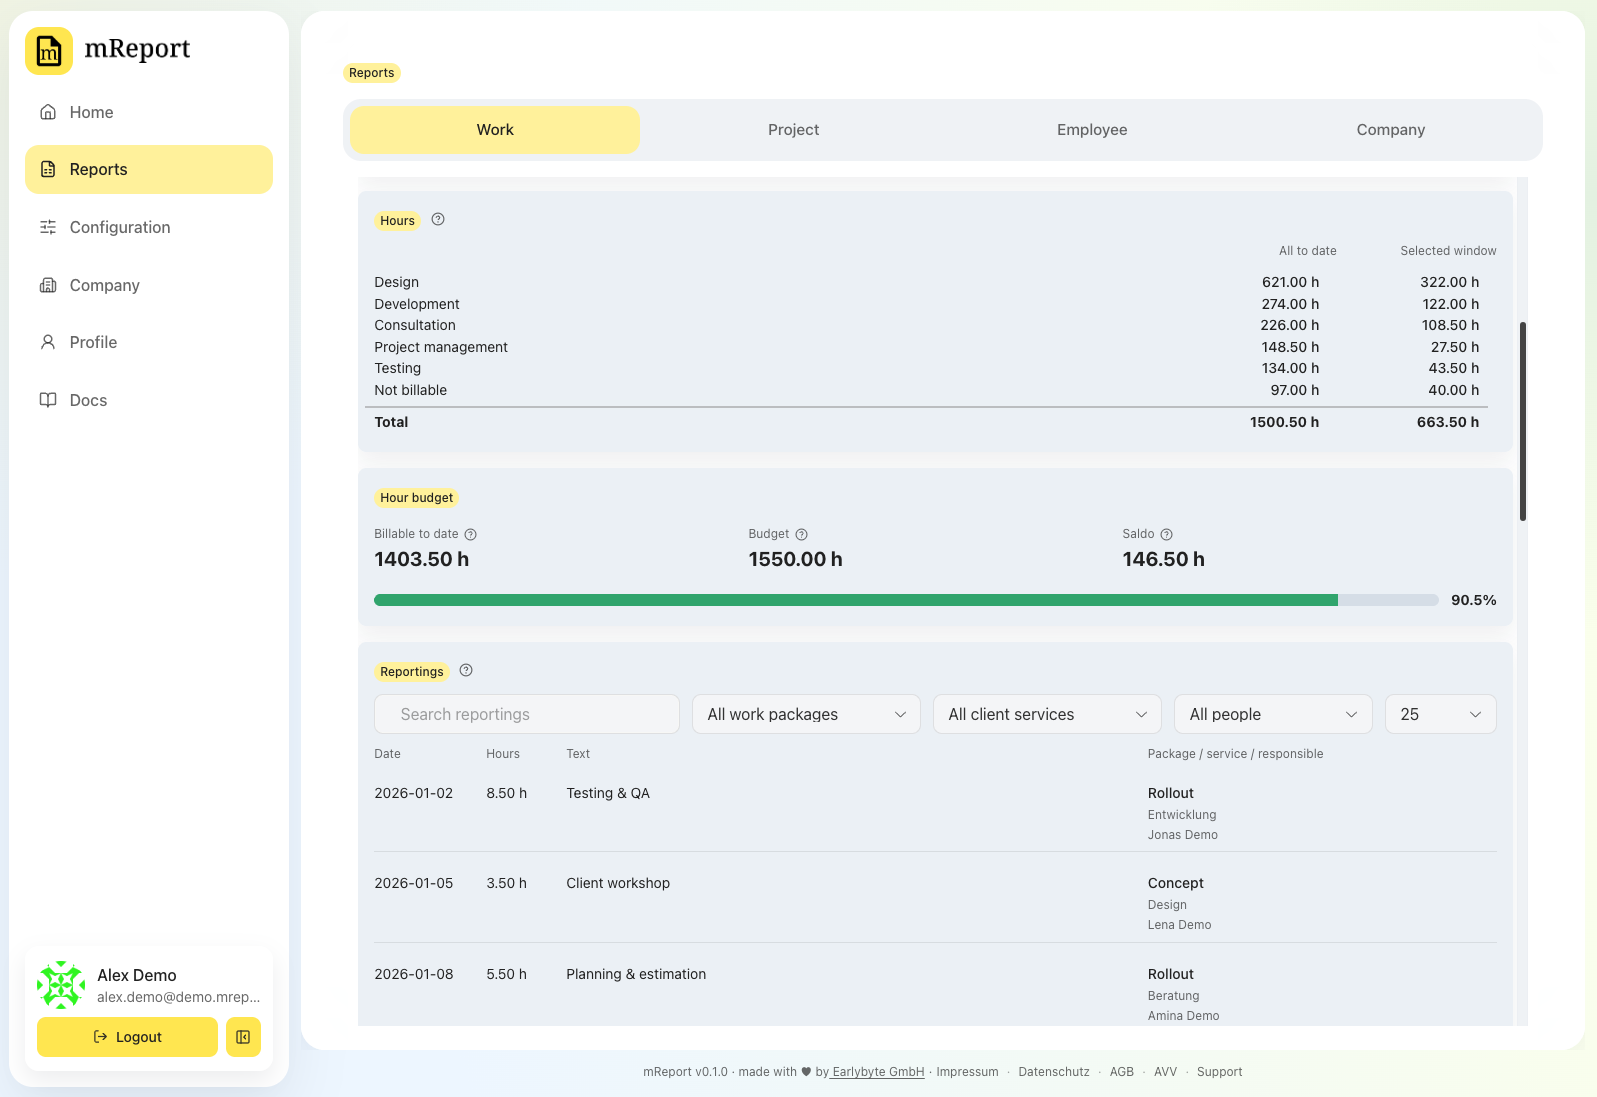
Billable hours against the agreed budget from the report configuration, read in the order the bar beneath is filled: billable to date, the budget it is measured against, and the Saldo left of it. The bar draws an overrun as its own red segment rather than clamping at full, and the Saldo turns red once it goes negative.
Periods
Month, year, a custom range or all to date. Which of the four the picker offers, and which one the dashboard opens on, come from the report configuration — see visible windows. Switching the period recomputes in the background.
The underlying time entries
The Reportings section lists the individual bexio entries behind the totals — useful when a number looks wrong and you want to see what produced it.
Export as PDF
The PDF prints what the dashboard shows, in the report's own language, and follows the same Sections switches down to the chart: your sender block and the client as recipient, then two donuts — the project to date and the selected window, each with the rings the report shows — and the same one hours table beneath, with a colour swatch per client service, an Anteil column and both hour columns. Each section is titled, as the dashboard's cards are. A group heading carries its own figures there rather than repeating them in a subtotal below its services, because a printed page has no hover and one line less per group is one page less on a long report.
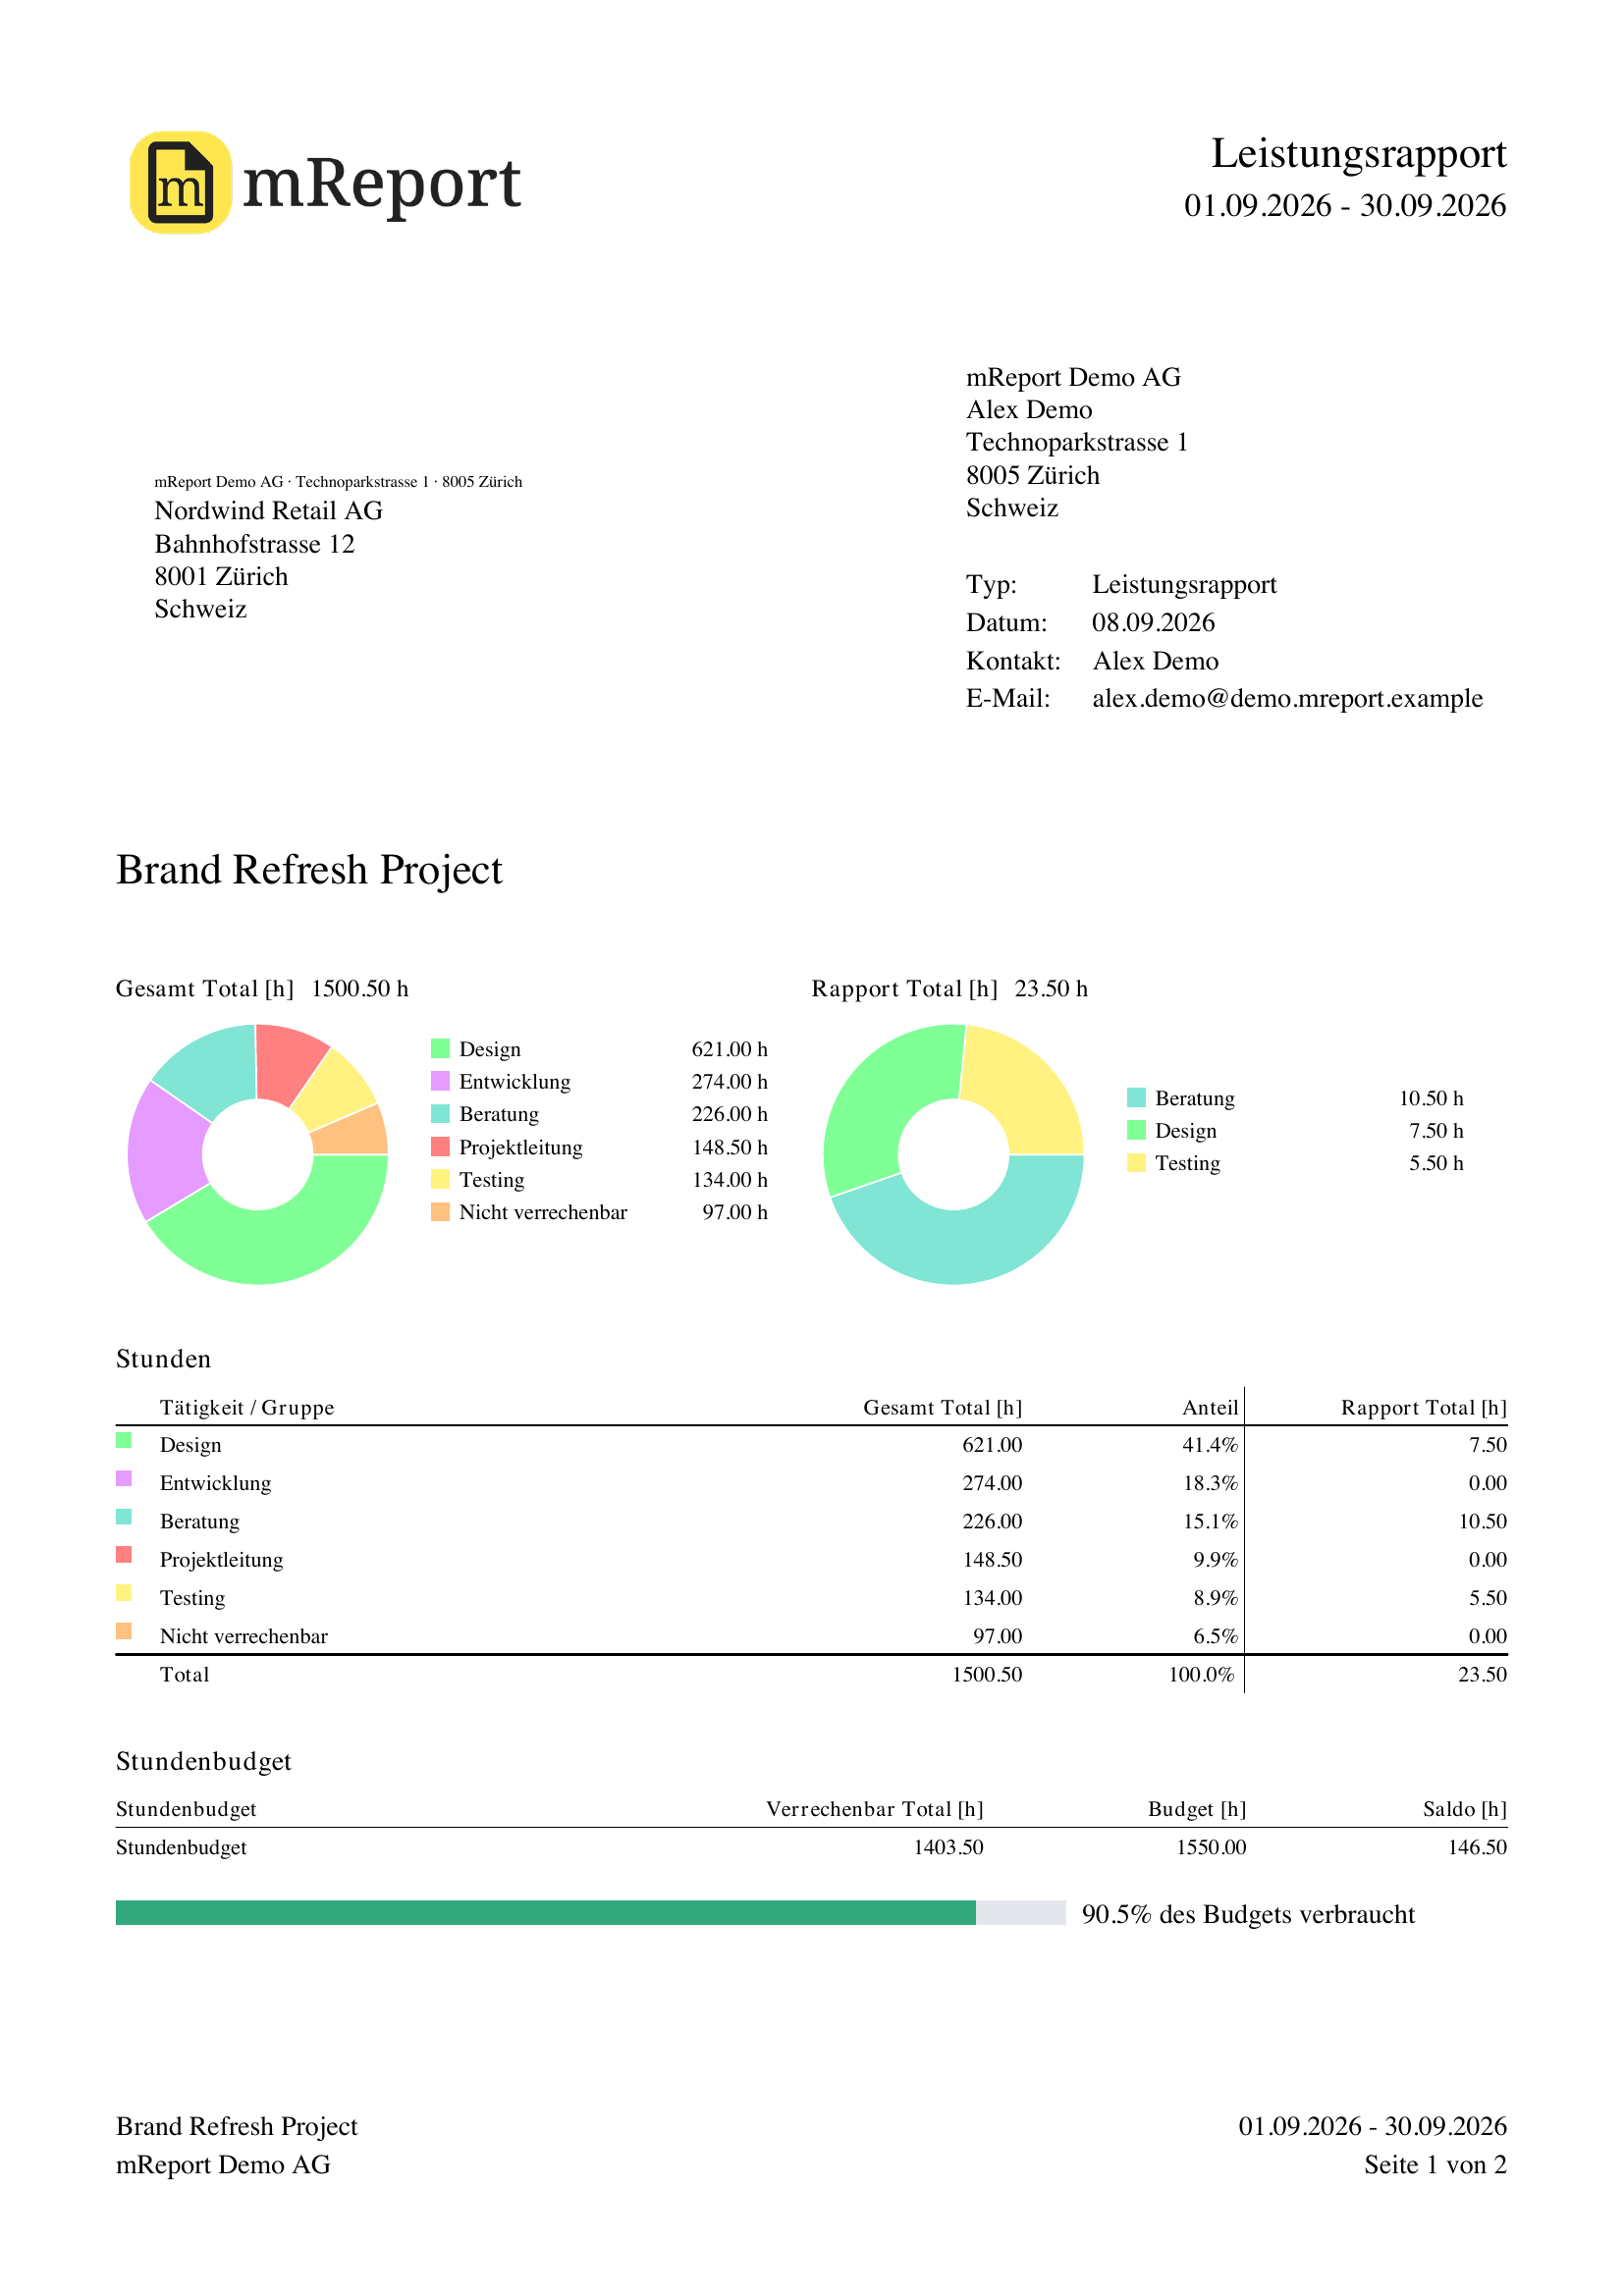 Stundenbudget closes the report body: billable hours to date, the agreed budget and the
Saldo, with the same two-segment bar beneath them as on the dashboard. The list of entries
then starts on a page of its own, headed by the disclaimer.
Stundenbudget closes the report body: billable hours to date, the agreed budget and the
Saldo, with the same two-segment bar beneath them as on the dashboard. The list of entries
then starts on a page of its own, headed by the disclaimer.
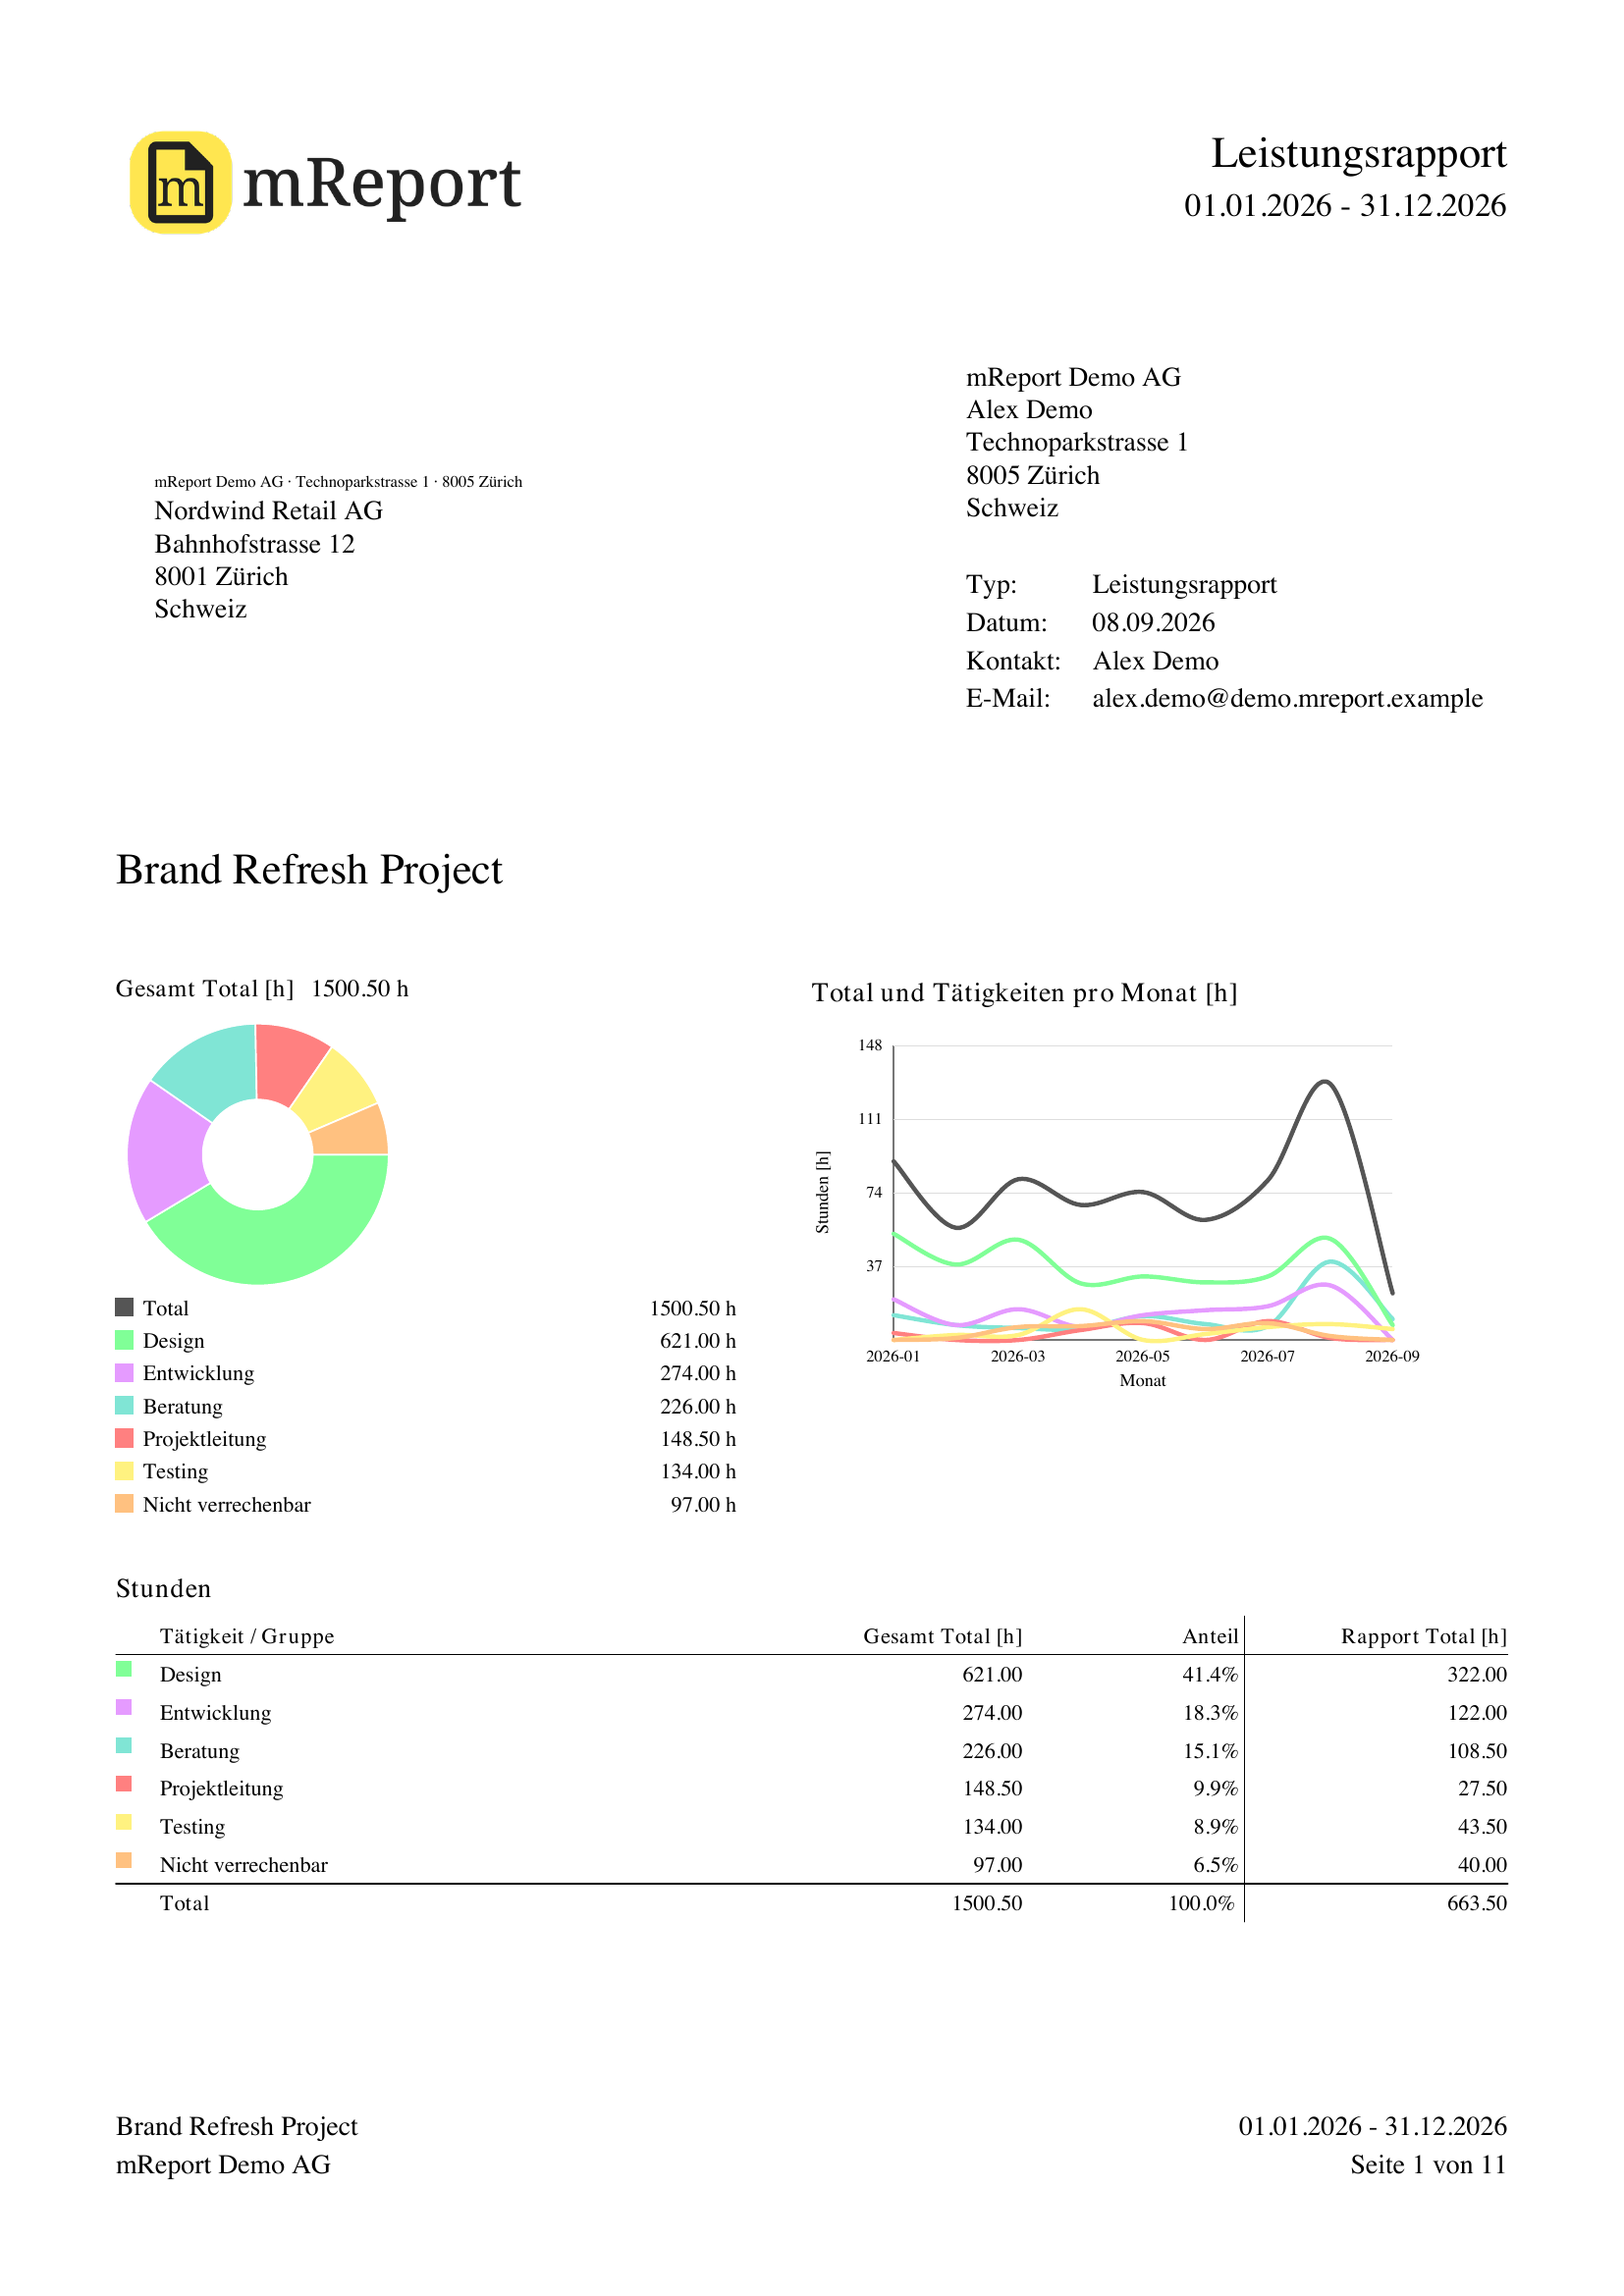
A yearly report keeps its monthly trend beside a single donut, since the second chart would leave no room for it.
Large reports
Reports above the row limit are prepared by a background job instead of rendering in the request. You get the download when it is ready.
Look before you spend an export
The eye beside the export button opens the same report as a preview: the real document at the real layout, with an outlined box where your logo goes. It opens in a window rather than downloading, and it does not count against your plan's monthly PDF allowance — so checking that the period, the filters and the sections are right costs nothing. The export carries your logo.
Changing what you see
| You want to | Go to |
|---|---|
| Change the chart colors | Chart colors |
| Change a client service's color slot or billable flag | Client services |
| Change the period, filters, rate or budget | Work report configuration |
| Change the contact printed on the PDF | Contacts |
| Add a disclaimer to the export | Disclaimers |